Cisco Nexus Dashboard
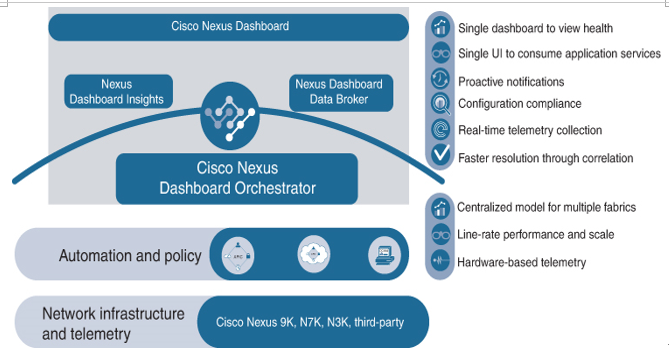
The Cisco Nexus Dashboard offers a centralized management console that allows network operators to easily access applications needed to perform the lifecycle management of their fabric, such as provisioning, troubleshooting, or simply gaining deeper visibility into their network. Using the Cisco Nexus Dashboard platform, you can deploy Cisco Nexus Dashboard Orchestrator (NDO), Cisco Nexus Dashboard Insights, and Cisco Nexus Dashboard Data Broker. The Cisco Nexus Dashboard becomes even more of a collaborative focal point with the inclusion of operations-critical, third-party applications and tools. From the Nexus Dashboard, you can cross-launch any of the sites’ controllers, including APIC, Cloud APIC, and Cisco Data Center Network Manager (DCNM) fabrics, which drives the adoption of cloud-native application practices.
Figure 9-21 illustrates the Cisco Nexus Dashboard.

Figure 9-21 Cisco Nexus Dashboard
Cisco Nexus Dashboard provides the following benefits:
- Easy to use
- Customizable role-based UI view to provide a focused view on network operator use cases
- Single sign-on (SSO) for a seamless user experience across operation services
- Single console for health monitoring and quick service turnup
- Easy to scale
- High-availability, scale-out operations from a single dashboard
- Scale use cases, leveraging flexible deployment options
- Operations that span across on-premises, multicloud, and edge networks
- Easy to maintain
- Seamless integration and lifecycle management of operational services
- Onboarding and managing of operational services across on-premises, cloud, or hybrid environments
- Single point of integration for critical third-party applications and tools
Cisco Nexus Dashboard Orchestrator
The Cisco Nexus Dashboard Orchestrator, which is hosted on the Cisco Nexus Dashboard, provides policy management, network policy configuration, and application segmentation definition and enforcement policies for multicloud deployments. Using the Cisco Nexus Dashboard Orchestrator, customers get a single view into the Cisco APIC, Cisco DCNM, and Cisco Cloud APIC policies across AWS, Microsoft Azure, and Google Cloud environments.
Cisco Nexus Dashboard Insights
Cisco Nexus Dashboard Insights provides the ability to monitor and analyze the fabric in real time to identify anomalies, to provide root-cause analysis and capacity planning, and to accelerate troubleshooting. By tracking historical context, collecting and processing hardware and software telemetry data, and correlating the designs with Cisco best practices, it provides excellent visibility and awareness of issues affecting the fabric and takes corrective actions. Nexus Dashboard Insights is a microservices-based application designed to be hosted on the Cisco Nexus Dashboard.
Cisco Nexus Dashboard Data Broker
The Cisco Nexus Dashboard Data Broker is a simple, scalable, and cost-effective solution for data center, enterprise, and service provider customers who need to monitor high-volume and business-critical traffic. It replaces traditional purpose-built matrix switches with one or more Cisco Nexus 3000, 9300, or 9500 Series switches that you can interconnect to build a highly scalable TAP-aggregation network that can help copy or mirror the production traffic using Optical TAPs (test access points) and Cisco Switched Port Analyzer (SPAN). The data broker also lets you integrate with Cisco ACI to configure SPAN sessions using the Cisco APIC REST API. It can run as an application on APIC or on Nexus Dashboard.